About this case study
Reduced rainfall, increased temperatures
State government
Advanced
‘As our climate changes, it will be important for us to have a detailed understanding of both water supply and demand under future climate conditions,’ says Mahes Maheswaran, Manager of Water Modelling and Advice at WaterNSW.
Mahes’s team are developing this understanding as part of long-term capital and operations planning that will form part of the Greater Sydney Water Strategy, involving WaterNSW, Sydney Water and the NSW Department of Planning and the Environment. The plans will be delivered to the NSW Government in mid-2023.
Project and outcomes
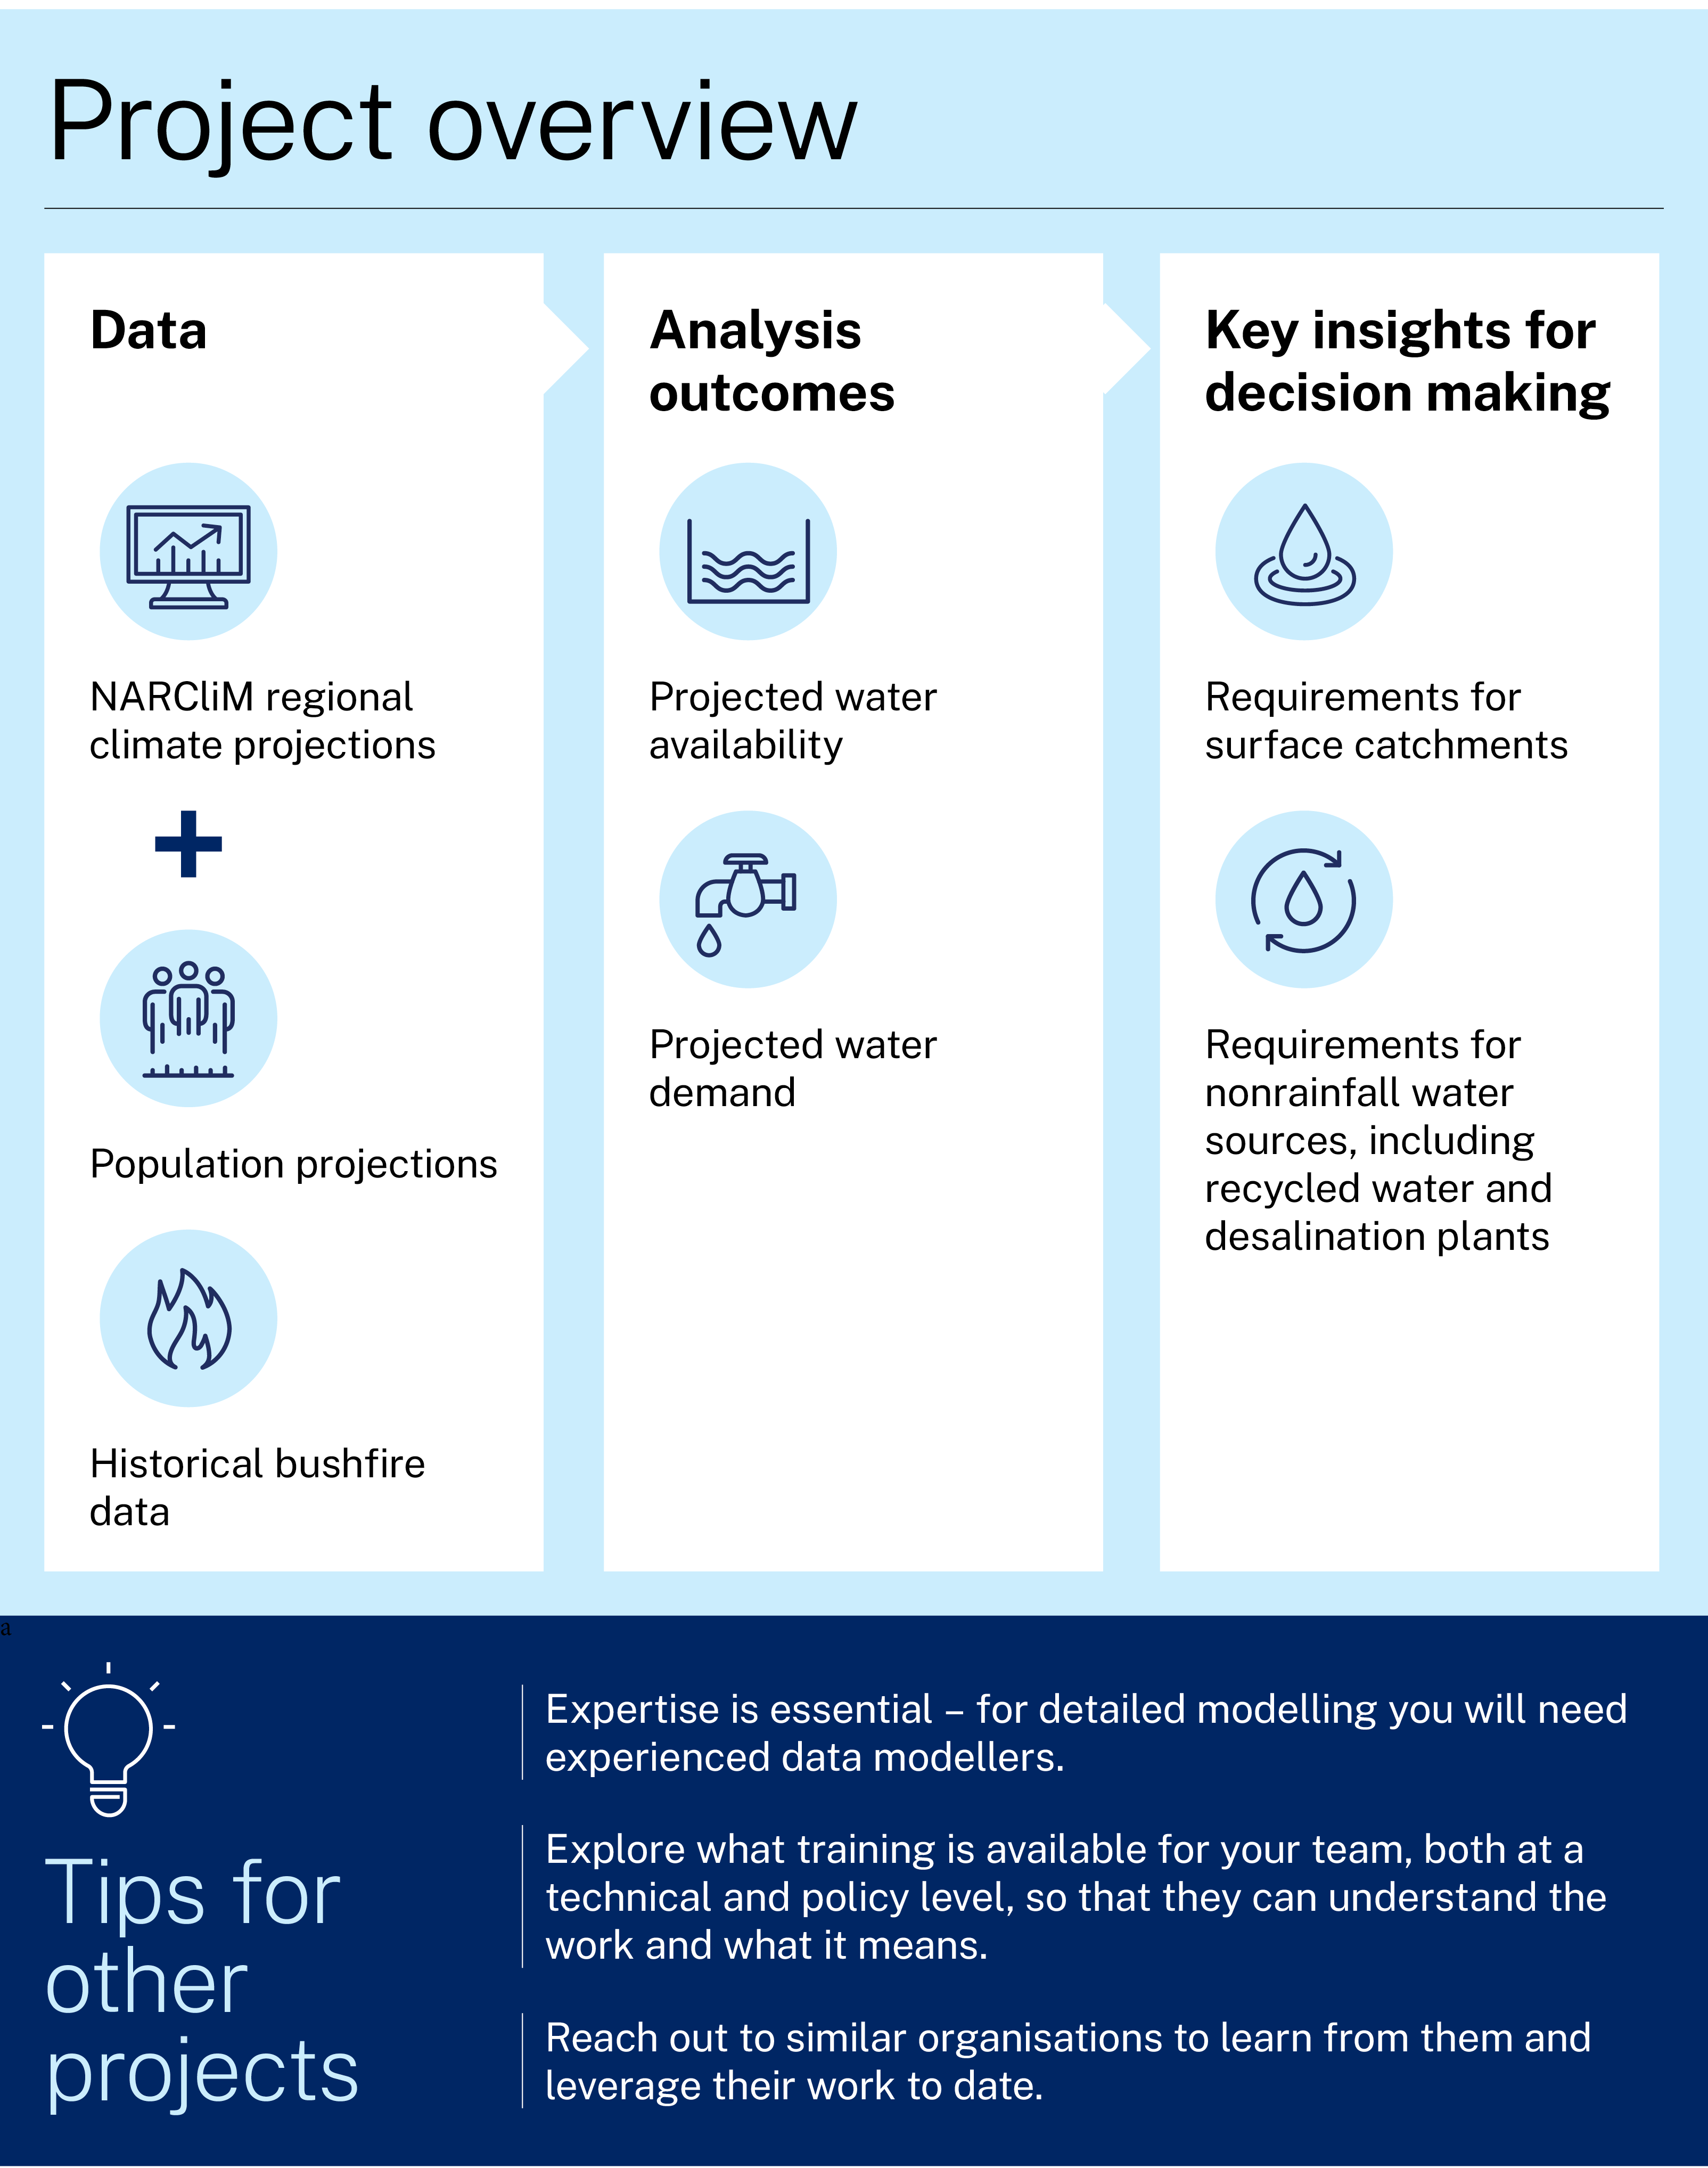
The Greater Sydney Water Strategy sets a long-term vision and direction to ensure resilient and sustainable water services for the people of Greater Sydney, including the Illawarra and Blue Mountains. Mahes explains that NARCliM regional climate projections have been essential to their work:
NARCliM is the only source able to give us the spatial and temporal information we need to develop scientifically robust climate models that fully meet our needs.
In the past, water planning models didn’t include climate change - they only included the supply projections based on historical rainfall records, together with projected population growth. But we now need much more information.
This project uses everything NARCliM can provide. We have taken full advantage of the various emissions pathways and regional climate models that NARCliM provides to model the climate variability we can expect and be confident in our projections.
The combination of NARCliM data with other data sources has also allowed the team to gain a complete picture of the future for water in Sydney. Mahes says:
Looking at rainfall only gives you half of the picture. Climate change will obviously influence supply as rainfall patterns change, but it will also influence demand - higher temperatures may increase demand as people use more water. Our job is to find out the gap between supply and demand, so we need to see how both supply and demand will change.
We combine rainfall and temperature data from NARCliM with population projection data from the Australian Bureau of Statistics, to give us both.
In another project we are also combining NARCliM data with historical bushfire data to see how water quality will be affected in the future. Some previous studies report that bushfires can triple the sediment load in our waterways, so increased frequency of bushfire may mean that water treatment plants will not be able to cope. We may need more investment in water treatment plants to continue to deliver good water quality for Sydney communities.
The information gained from the water supply planning models will be used to drive long-term capital planning across several NSW Government portfolios. Meeting the gap identified between water supply and demand will involve the use of nonrainfall water sources, such as recycled water and desalination plants. The detailed information available from the project is providing a solid evidence base to plan upgrades to existing plants, and decide on the timing, size and location for new plants.
Learnings and considerations
‘Combining the full NARCliM dataset with our models was a significant undertaking,’ says Mahes. ‘Our data team needed to update the catchment models, calibrate and test against historical data. The project has taken almost 2 years.’
But despite the challenges, Mahes says that NARCliM still provided the best option for the work:
The only other method we could have used is statistical downscaling, but it doesn’t capture topography, such as the escarpment effects we see in Sydney rainfall. So, it would not have produced the technical detail we need for this project.
Mahes recommends that other organisations wanting to use NARCliM draw on the work and experience of previous projects. He says:
We now have a highly automated system - we can extract and assemble data very quickly. When NARCliM2.0 becomes available, we will be able to run the models again very easily.
We’re looking to share this system and scripts with others. This means they’ll be able to use our existing systems to rapidly produce results they can use in their own projects, but it also means that our work will be checked by others and have an extra process of quality control, so we can be even more confident in its use.
Mahes believes more training is needed, for both modellers and decision makers. ‘Big data can be quite mind boggling, and at the moment not many people have the technical skills to use data,’ he says. He also highlights the importance of education and skills development for people to use climate projections, and to effectively communicate the results, so that decision makers understand what the science means.
Case studies

AdaptNSW has developed A Climate of Change – a free, evidence-based resource package that helps educators support students to build resilience, navigate difficult emotions and find hope in a changing world.

The case study outlines research led by the University of Tasmania with NSW Government agencies assessing air quality improvements in the Port Macquarie public library during smoke from the 2019–2020 fires. It compared central air conditioning with portable HEPA cleaners to evaluate the library’s potential to operate as a community clean‑air shelter.

On the New South Wales South Coast, a project bringing Aboriginal cultural custodians into the bushfire emergency control room is reshaping how decisions are made under pressure.