About this case study
Increased temperatures
Research
Advanced
The changes to our environment and weather brought about by climate change are affecting many aspects of our lives, including our health. Changes to temperatures, extreme weather events and disease vectors such as mosquitoes will all play a role in the future health landscape.
Dr Ivan Hanigan is the Director of the World Health Organization Collaborating Centre for Environmental Health Impact Assessment at Curtin University and was formerly of the NSW Government-supported Climate Change, Human Health and Social Impacts Node, based at the University of Sydney. He leads a team of researchers investigating the impact of climate change on health in Australia.
Project and outcomes
Ivan explains he has been involved in various areas of research:
We have conducted various research projects about the intersection of climate change and human health, such as the links between heatwaves, urban heat island and mortality; the links between drought and suicide in rural areas; and the effects of climate change on Aboriginal communities.
This is a key area of research. I was also involved in a project on environmental health indicators, which aimed to develop a system for tracking health impacts from environmental risk factors for NSW communities, to enable key areas of concern to be identified and prioritised.
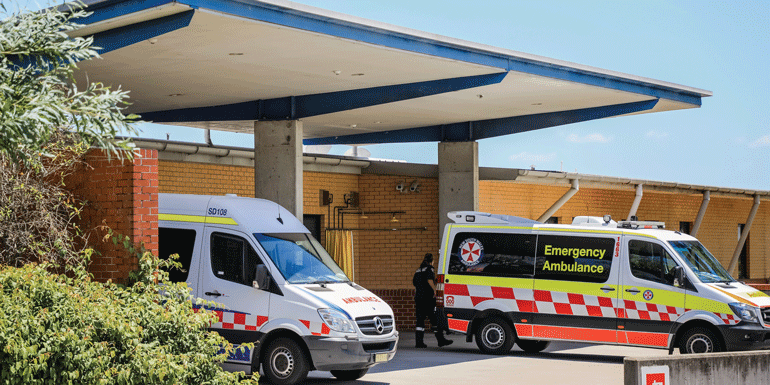
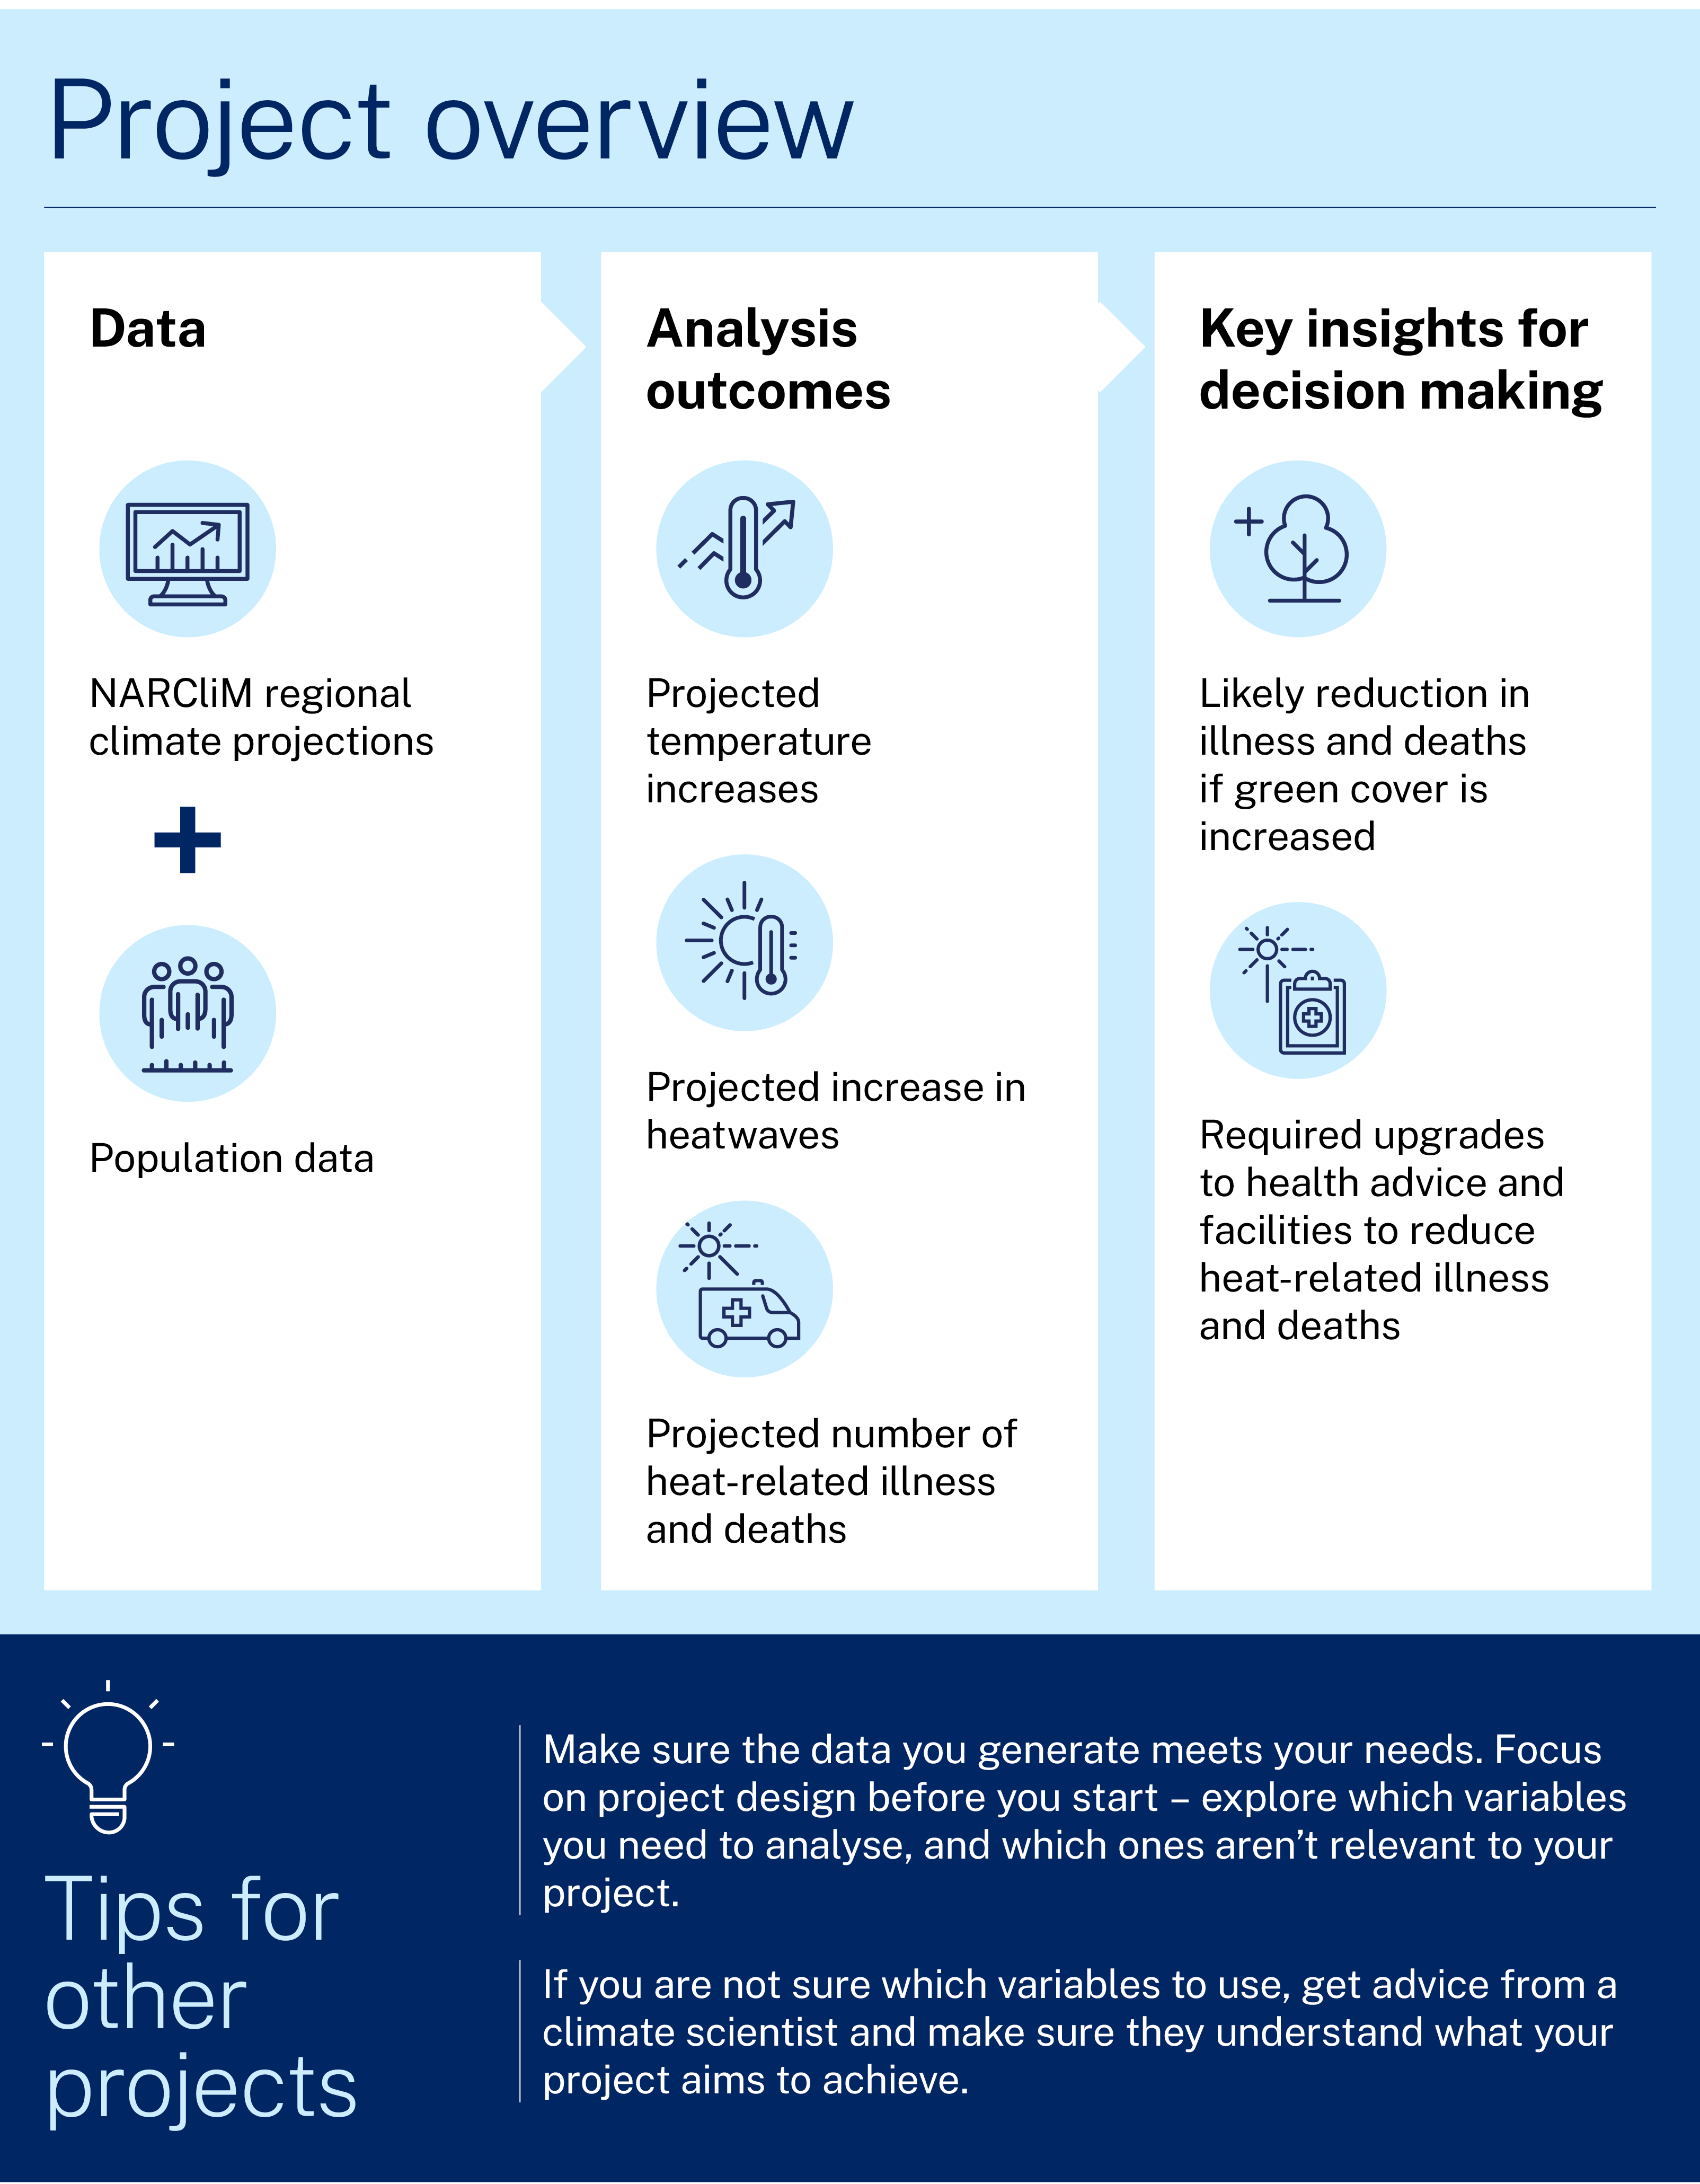
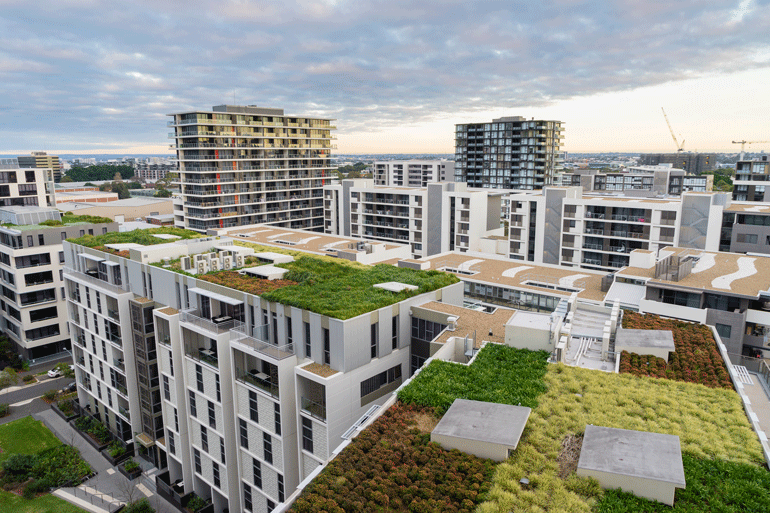
Most recently, the team used NARCliM regional climate projections to look at the future heat island effect in Australian cities, including the likely number of deaths caused by future heatwaves in Sydney. The heat island effect is where urban areas experience higher temperatures than surrounding regions, because the higher concentration of buildings and hard surfaces in these areas absorb and retain heat. Ivan says:
The risks associated with the heat island effect will increase under climate change, and it’s important that we understand the risks and the role that strategies such as urban greening can play in reducing risk.
Learnings and considerations
Ivan says that his main advice for other researchers working with NARCliM data is to be clear about the questions they are asking. He says:
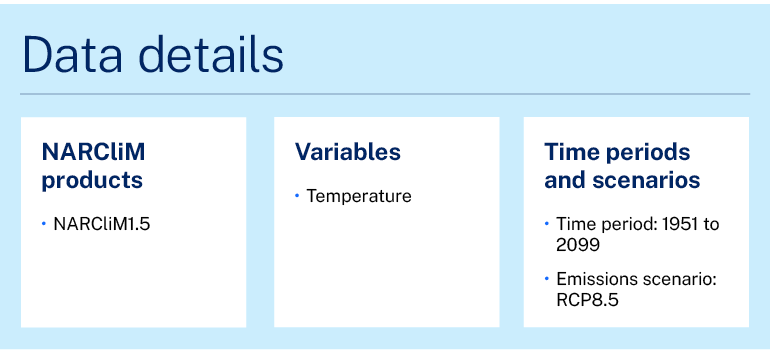
NARCliM provides various models and options, and as scientists it is always tempting to simply compare everything to see whether patterns emerge. But in climate change research, you may simply produce a kaleidoscope of data without answering your question. For example, NARCliM1.5 uses 3 global climate models and 2 regional downscaling models for each of its emissions scenarios (RCP4.5 and RCP8.5). The team started comparing the different models for RCP8.5 to see the variability and produced a huge table of data that ultimately wasn’t useful, so we used an ensemble approach instead.
It’s important to spend time to make a good study design before you start modelling. Be very clear about what you are trying to achieve and the questions you are asking, and then make sure that the pathway and models you use are suited to the research question. For example, if you are looking at drought effects, you would look at a hot, dry scenario and compare it with a low warming, moist scenario. Know which variables are worth comparing, and which are irrelevant or insignificant for your purpose.
Ivan also says that the expertise of the team is vital:
I would recommend working directly with climate scientists. Our urban heat project had a climate scientist involved all the way through, which made it much easier to use the models.
However, we did have different perspectives on things. For example, the climate scientist masked the coastal data because those areas cause bias in the model. But of course most Australian cities are on the coast, so we needed the unmasked data.
Establishing an interdisciplinary team would solve most problems – interdisciplinary, not just multidisciplinary, with real 2-way communication and collaboration. Involve climate scientists early to develop a shared vision of the project, and ensure they are pragmatic about finding the most meaningful data and comparisons for the purpose of your project.
Ivan has now started focusing on the emerging impacts of present climate change instead of future scenarios. While Ivan has no immediate plans to use NARCliM for other research projects, he is developing a course in climate change, health and big data, so may also use NARCliM to teach students how to use climate projections data.
He says ‘There’s a real call for experts in the area, so I’m excited to be starting on this course, so that we develop people with the skills we need.’
Case studies
NSW councils are building climate risk into their business-as-usual planning and policies for the first time, thanks to products developed using NARCliM’s locally relevant climate modelled data.
Learn how NARCliM climate projections are being used by various NSW sectors to understand and adapt to climate change.
When a local risk research firm began work on the ‘Blueprint for a Resilient South-East NSW’ project, they turned to NARCliM to get the data they needed to develop a comprehensive picture of regional climate risk.