
About this case study
Increased temperatures, urban heat island effect, extreme events
Local government
Moderate
In 2018, the Resilient Sydney Strategy was released to provide a pathway for resilience across the metropolitan area, including Penrith. Belinda Atkins, Sustainability and Resilience Lead, explains that the Resilient Sydney Strategy provides a framework for Penrith to develop its own localised action plan, using local information.
‘We wanted to do our own climate change risk assessment to see the vulnerabilities for Penrith, to see what it means for our community and enable us to better plan for the future,’ says Belinda.
'Communities with a higher level of resilience have a greater capacity to withstand shocks and stresses and can recover more quickly. Council has developed a draft Resilient Penrith Action Plan that is aligned with the Resilient Sydney Strategy 2018 to demonstrate our commitment to building a more resilient city and community.’
Project and outcomes
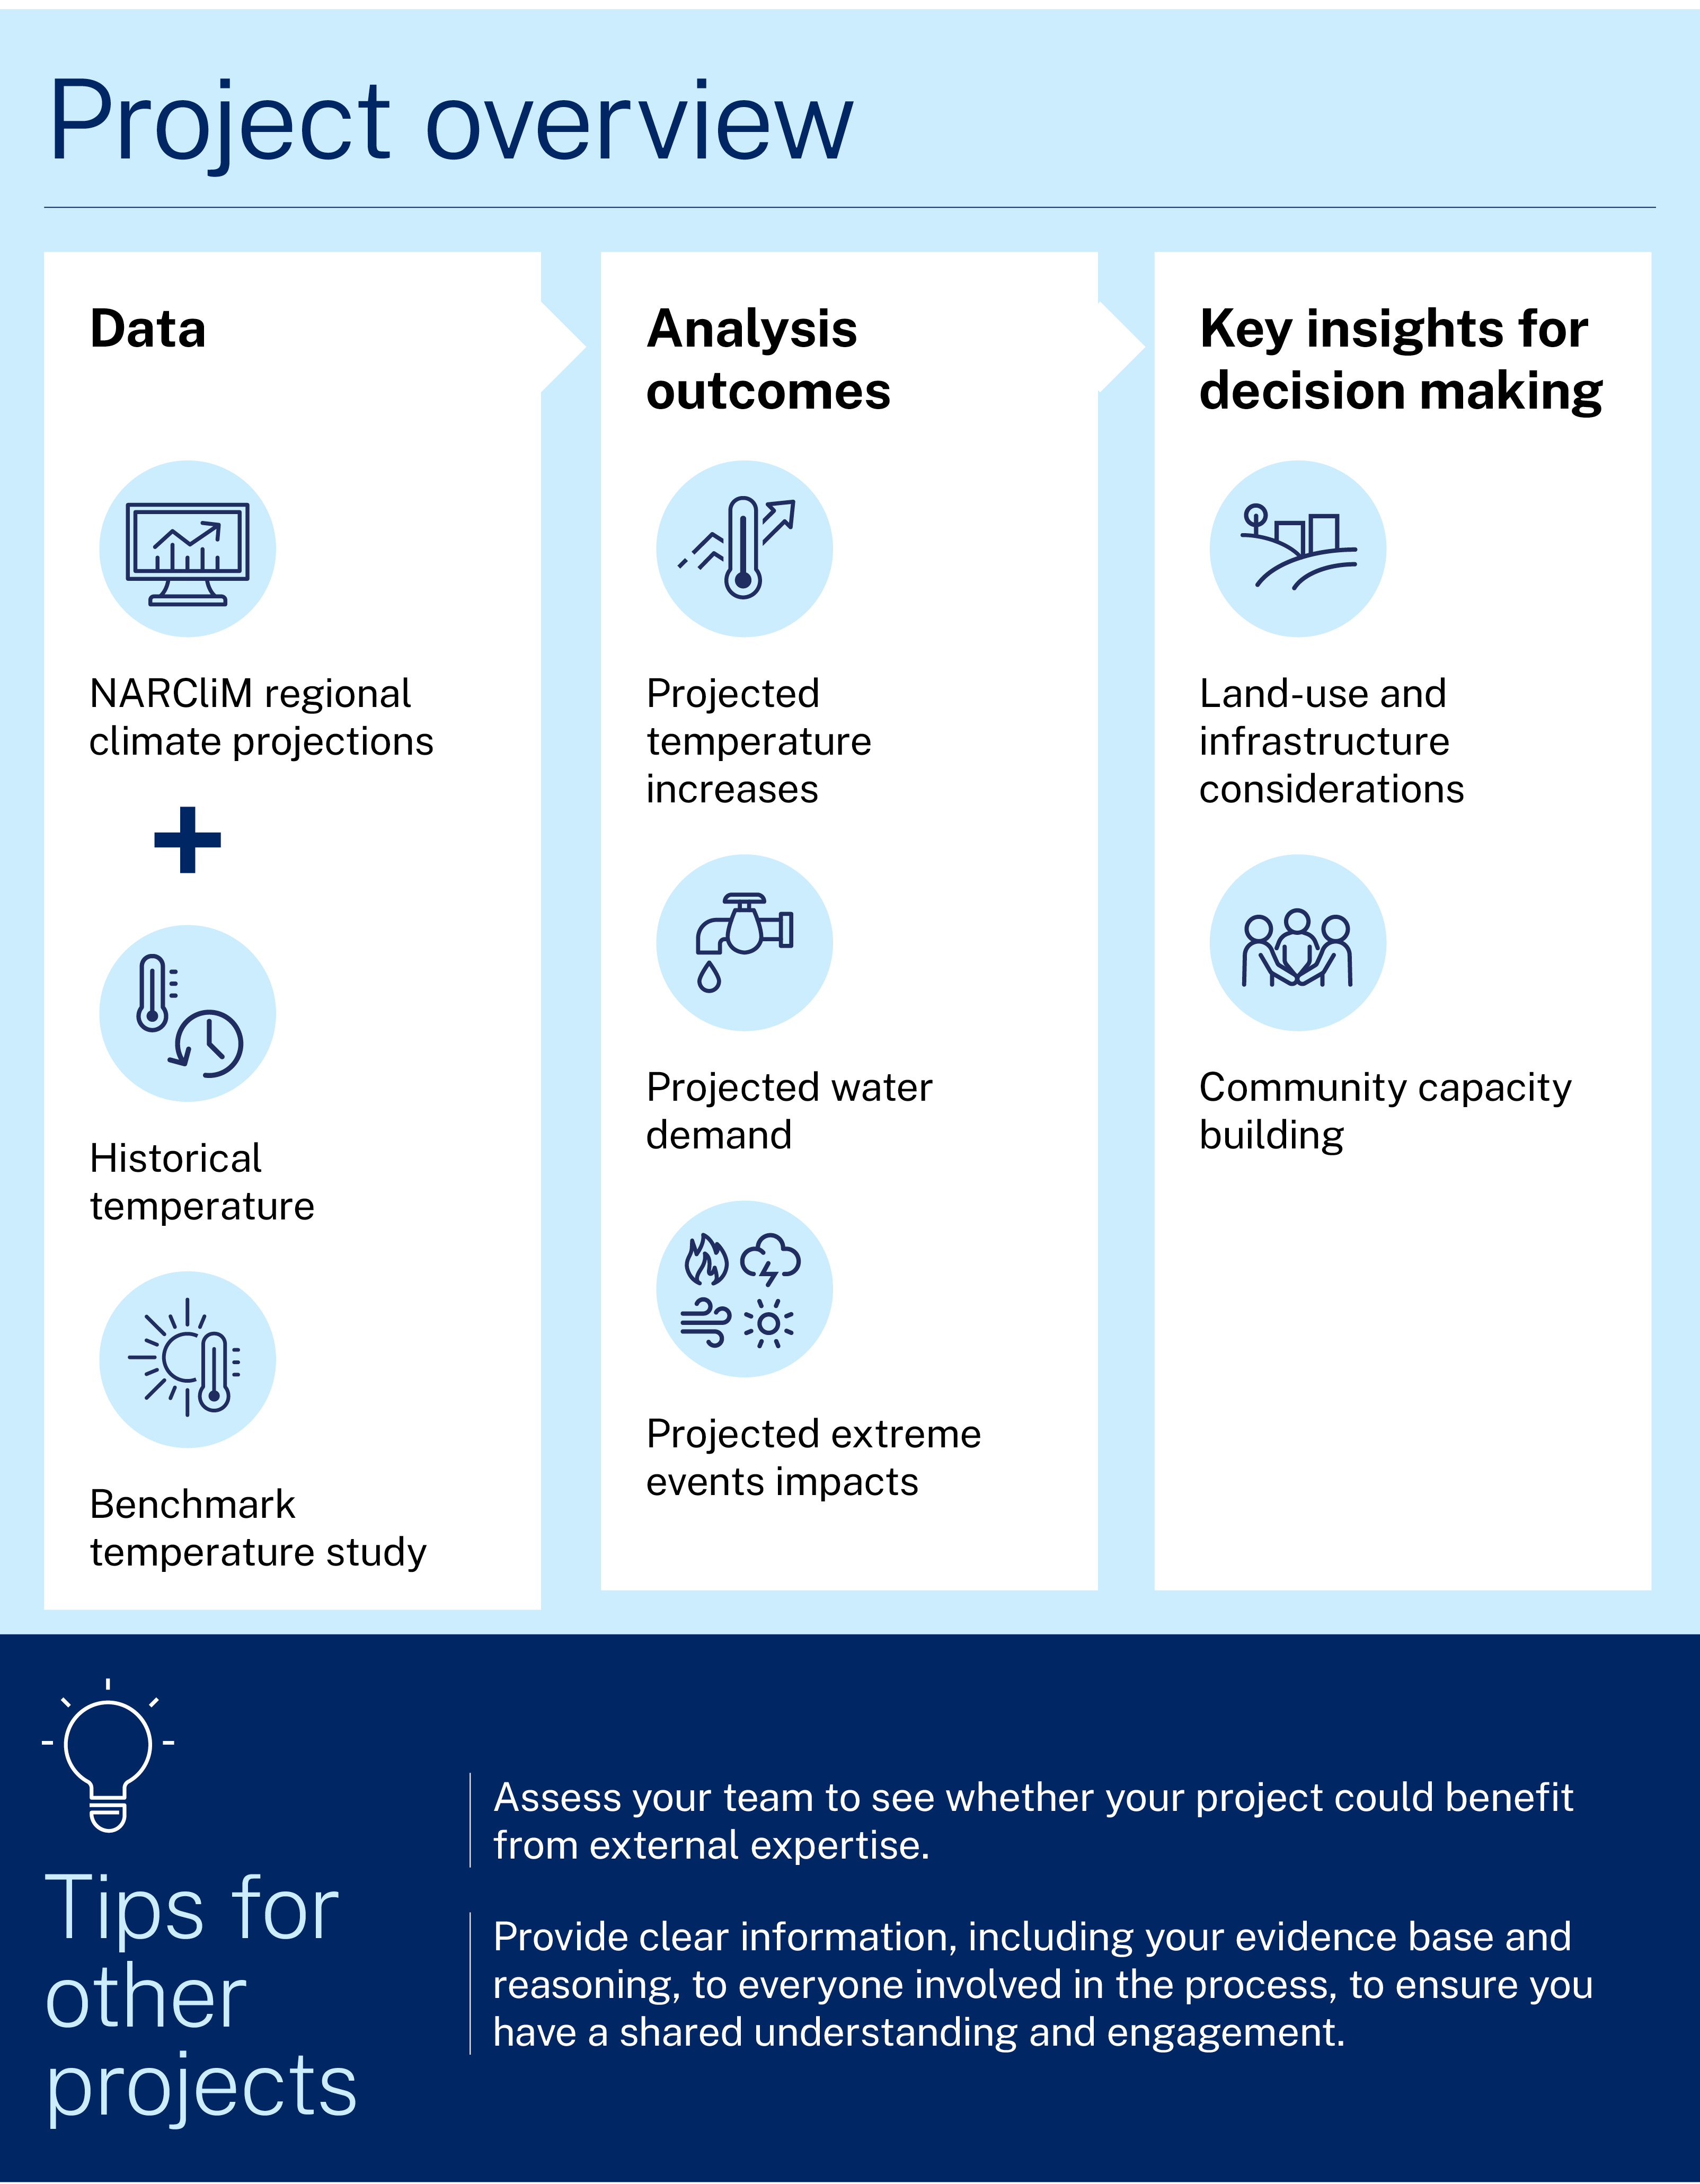
The Penrith project team began the climate risk assessment by looking at 2 products created from NARCliM's climate projections: the interactive map and regional snapshots. Then, through their membership with Sustainability Advantage, they engaged a consultant to work through the assessment process using the Guide to climate change risk assessment for NSW local government.
Belinda explains that NARCliM data were an integral part of the assessment done by the consultant and team. The team also found that other local data, such as from the Bureau of Meteorology (BoM), added significantly to the analyses. She says:
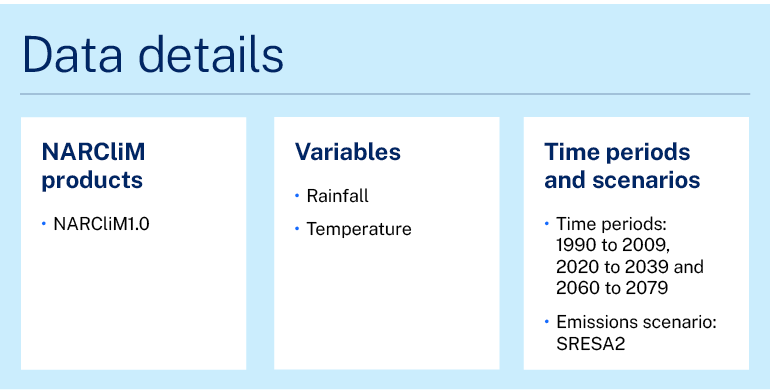
We pulled NARCliM data into our own risk assessment. We used data specific to Penrith when they were available, and Sydney metro data for the rest.
The data available for Penrith were mainly rainfall data. But we also compared data on temperature changes from BoM, the AdaptNSW snapshot, and the results of a benchmarking study we did in the summer of 2019–20. In looking at days that were more than 35 degrees, we found that we actually experienced 15 more days over the summer than what BoM or the snapshot projected.
This is most likely because of the urban heat island effect. We only have one BoM sensor station in Penrith, and because it’s in the lake area, it’s not really representative of our region.

The initial analyses informed a series of 9 workshops held with council management and wider staff. The consultant prepared a pre-reading document for the workshops, detailing background information about climate change; potential climate risks; and the data for the region across the different NARCliM1.0 time periods – baseline, 2020 to 2039 and 2060 to 2079.
The workshops explored the future climate impacts for the region and collected information on key risks for each council responsibility sector. Belinda explains that this information was then used to build the action plan, based on the severity, likelihood and impact of the risk. She says:
We went through this process department by department. We then went back to the consultant to see where overlaps occurred, so we could end up with a concise description of key risks. We ended up with a council-wide risk assessment that identified 48 risks – from extreme to low. We then embedded the risks into our corporate risk registers.
We ran the risks through our own risk-analysis software, which we use for corporate risk assessment. This shows what residual risks remain after mitigation. If the residual risk was over our tolerance level, then we investigated what actions to take to avoid that risk.
All of this was included in the action plan, which pulls all these risks together and identifies actions. The plan goes from 2021 to 2030, but will be reviewed every 4 years. We will also look at it every year to see what to include into the annual operational plan. In September, we will see the results of the first year of this process.
Belinda says that the climate risk assessment and resultant plan ties into a wide range of council operations and initiatives.
All of this work is interlinked across council. For example, the Resilient Penrith Action Plan ties in with our Cooling the City Strategy, which also used NARCliM data. This strategy aims to address urban heat with actions that include more parks, shade, tree planting, water-sensitive design, and capacity building for the community, to enable people to take part in this work in their own homes and blocks. And both the Resilient Penrith Action Plan and Cooling the City Strategy tie in with land-use planning.
Learnings and considerations
Belinda found that the consultant’s data and project expertise provided valuable input to the process. She says:
We could potentially have done the project without them, but not near as well! We have limited staff, and they provided both the data expertise and the project management structure that we needed. They also offer credence to the process. We could step back and let them come in as the experts.
Belinda explains that they also played a key role in communications, by providing clear data and information. She says:
It’s a really good idea to provide the information upfront to people. In our case, a lot of people across council hadn’t seen the science or hadn’t really thought about it.
We did direct people to look at the AdaptNSW website, but the consultant simplified the information and tailored it to the audience. They pulled in the data and repackaged NARCliM for our needs.
Both providing and tailoring the information really brought everything together and gave us a good basis to work from. The pre-reading document facilitated a shared understanding and trust with all our staff and stakeholders.
For other organisations conducting a similar process, Belinda recommends that clear data be supported with background information to increase engagement.
It’s important to present the background to the data – how the projections were done, where the data came from and the reasoning behind it. There are still some climate change sceptics out there, so this is important.
For any planning we don’t just want to say ‘we want to do this’. We show the evidence base and explain clearly why we’re doing it. Then the organisation can move ahead together.
Case studies
Learn how NARCliM climate projections are being used by various NSW sectors to understand and adapt to climate change.

The NSW Government has created the first holistic adaptation plan to protect a World Heritage rainforest from climate change impacts – and now ground-breaking genetic science is giving some rare and threatened species a helping hand to adapt and evolve.

Ensuring there’s enough water in the moat may not be a common challenge for those preparing for changing climate conditions.